- Published on
Kernelbench Agent
- Authors

- Name
- Jack Youstra
- @jackyoustra
Author's Note: This was all done and written up a few months ago - I somehow forgot to publish it!
Introduction
So! Everyone is vibe coding. The hardest part about vibe coding, is, of course, the verifier: how do you know if the viber made the correct code? Usually the answer is when a senior engineer yells at you and tells you that your code is hopelessly buggy.
Fortunately (or unfortunately depending on who you are) the kernels that make up modern LLMs are remarkably easy to test. Want to see if it's correct? Check if it produces (roughly) the same output as a preexisting sample. Want to see if it's fast? Benchmark it.
Because we have a good verifier, it is a ripe target for a particularly automated vibe coding loop:
attempts = []
for _ in range(N):
  kernel = ask_llm(attempts)
  evaluation = evaluate(kernel)
  if evaluation.correct and evaluation.speedup > 1.10:
    log_success()
  else:
    log_failure()
  attempts.append((kernel, evaluation))
Super simple and easy! This is the core agentic loop as featured in the ReAct paper (Reason + Act: models alternate between reasoning about what to do and taking actions via tool calls).
Background
What's a Kernel?
A kernel is a function that runs on the GPU, processing thousands of elements in parallel. Modern LLMs are built from kernels: matrix multiplies (GEMM), attention mechanisms, layer normalization, activations like GELU. Every forward pass through a billion-parameter model executes hundreds of kernels millions of times. These GEMMs are by far the most performance-critical kernels in modern LLMs, so they're a clear focus for optimization research.
The KernelBench Challenge
KernelBench (HuggingFace dataset) contains 180 kernel optimization problems across 3 difficulty levels. Here are examples:
Level 1 (Simple): 100_HingeLoss
def forward(self, predictions, targets):
    return torch.mean(torch.clamp(1 - predictions * targets, min=0))
Task: Replace with custom CUDA that's faster than PyTorch's built-ins.
Level 2 (Fusion): 80_Gemm_Max_Subtract_GELU
def forward(self, x):
    x = self.gemm(x)  # Matrix multiply: (batch, in_features) → (batch, out_features)
    x = torch.max(x, dim=1, keepdim=True).values  # Max along features
    x = x - x.mean(dim=1, keepdim=True)  # Subtract mean
    x = F.gelu(x)  # GELU activation (smooth approximation of ReLU)
    return x
Task: Fuse these operations into a single CUDA kernel to eliminate intermediate memory allocations. PyTorch executes this as 4 separate kernel launches with 3 intermediate tensors written to GPU memory. A fused kernel can do everything in one pass.
Level 3 (Architectures): 26_ShuffleNet - Full 3,352-char CNN architecture with grouped convolutions, batch normalization, channel shuffle, and residual connections.
Correctness is verified by checking outputs match within 1e-5 tolerance. Performance is measured against multiple PyTorch baselines.
The Baselines are Strong
PyTorch provides several execution modes:
eager: Direct cuDNN-backed operations (NVIDIA's hand-optimized kernels)torch.compile: PyTorch 2.x JIT compiler that automatically fuses operations and generates optimized code via the Inductor backend (uses Triton for GPU codegen)
The torch_compile_inductor_reduce-overhead baseline is particularly aggressive—it performs kernel fusion, eliminates redundant memory accesses, and optimizes launch parameters. To beat it, you need either:
- Algorithmic insights (exploit problem-specific structure)
- Advanced libraries (CUTLASS for GEMMs, custom Triton kernels)
- Better fusion strategies than the compiler found
How Experts Optimize Kernels
There are many ways to optimize a kernel, including theoretical spreadsheet work, coffee chats, staring at the code until 3am, etc. One possible useful workflow for some kernel engineers is the following:
- Profile: Run
ncu(Nsight Compute) to see:- Which kernels are slow
- Memory-bound vs compute-bound
- Occupancy (% of GPU utilized)
- Memory coalescing efficiency
- Analyze: Identify the bottleneck (bandwidth? warp divergence? launch overhead?)
- Fix: Apply targeted optimization (kernel fusion, shared memory, better access patterns)
- Verify: Benchmark and check correctness
The question: Can we give AI these tools and have it follow this workflow?
There's a few existing projects out there that try to tackle this problem:
- METR's KernelAgent achieves 1.8x average speedup using parallel tree search
- Cognition AI's Kevin-32B demonstrates 65% correctness with multi-turn RL
- Sakana AI's CUDA Engineer claims 10-100x improvements through evolutionary optimization
- Meta KernelLLM, fine-tuned on (torch, triton) pairs
Notably, none of these give the agent access to profiling tools (ncu, nsys) or extensive GPU documentation. Can systematic debugging close the gap?
The broader thing that I want to point out is, in my mind, these things are way too under-harnessed. Expert GPU programmers don't randomly modify code hoping for improvements and are fixed. They:
- Profile the kernel to identify specific bottlenecks
- Consult documentation for optimization strategies
- Apply targeted fixes based on profiler insights
- Iterate until performance goals are met
There's not much of a way for the AI to do it in any prior work! I hope that by giving it a search tool, a persistent terminal in a completely tooled-up docker image, and a local copy of the accelerator documentation it can start to learn how to do really strong kernel development.
Methodology
To evaluate this systematically, I used Inspect to run controlled experiments:
Evaluation Setup:
- Models tested: Several frontier models, with most of our runs on the most capable engineer: Qwen3-Coder.
- Dataset: KernelBench levels 1-3
- Total runs: 956 trajectories
- Systematic ablations: text_editor (on/off), token limits (50k-10M), max attempts (5-20)
The agent gets:
gpu_serial_bash(must be serial for profiling: concurrent runs could interfere with each other, as could running it and the evaluation at the same time)- Optional
text_editor(for iterative code editing) - Documentation for the particular ISA (
/materials/ptx_isa_8.7.mdin the container) web_search(Exa)
Each submission is scored by comparing runtime against multiple PyTorch baselines (eager, compile, inductor variations). The frontier evaluation serves three purposes: benchmark current capabilities, generate trajectories for future SFT, and identify failure modes for RL reward shaping.
Here's the system architecture:

Results
Terminology:
- "Success" means the code existed, compiled, and was correct (no speedup requirement)
- "Speedup" is
baseline_time / custom_kernel_time. Values >1.0 are faster (good), <1.0 are slower (bad) - Token axes go up to 1M tokens
Three Surprising Findings
Before diving into the data, here's what I found:
- Anti-Test-Time-Scaling: Success rate peaks at 2-4 attempts (~70%), then crashes to <10% beyond 8 attempts
- Thinking Models Fail More:
qwen3-235b-thinking: 25% vsqwen3-235bregular: 78% (n=116 vs n=207) - Tools Go Unused: In some trajectories, the models had profilers available and mentioned them in reasoning. Despite this, they almost always remained unused.
These contradict expectations from test-time scaling literature. The mechanisms are revealed through trace analysis below, but it's probably due to not RL-ing on it (rejection sampling seems limited) and insufficient generalization from target models. I'd be interested in people trying to run some rollouts on 4.5 Haiku.
Finding #1: More Attempts Make Things Worse
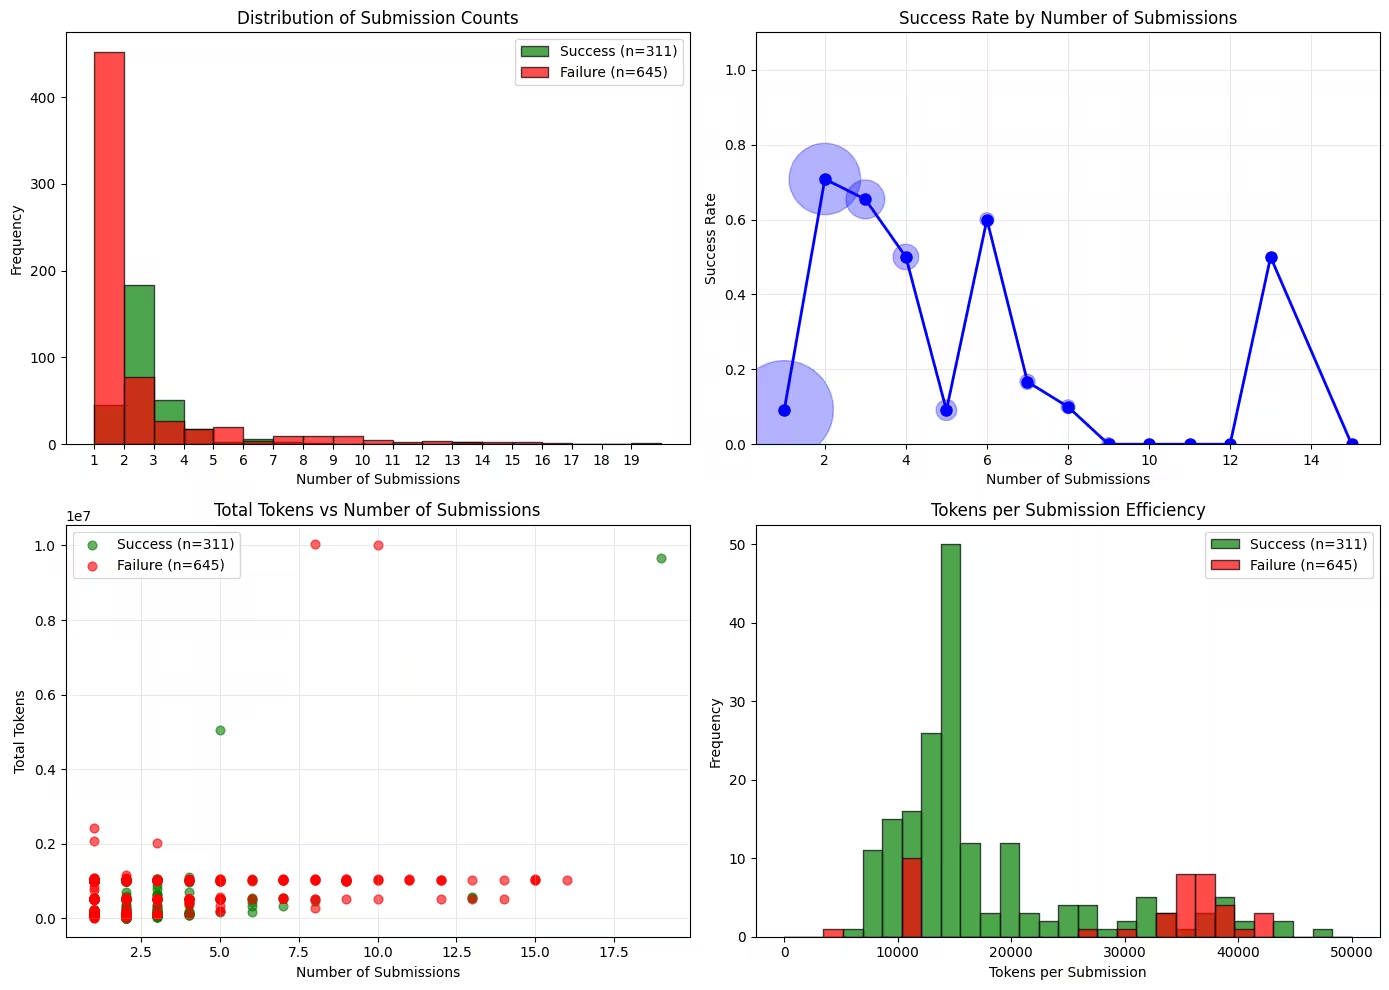
The top-right panel tells the story: success rate peaks at 2-4 submissions (~70%), then crashes. By 8+ submissions, success rate drops below 10%. The bubble sizes show statistical confidence.
This is the opposite of test-time scaling. Initially, I expected models to improve with more iterations—they don't. Instead, they get stuck.
Why? For this section, I examined 15 long traces (>100 messages each) from qwen3-coder runs. The pattern is clear: early attempts explore different solutions, but later attempts "optimize" a working solution and break it. Once broken, models can't recover—they get stuck in loops trying to fix the same bug repeatedly.
Finding #2: Thinking Models Have Terrible Success!
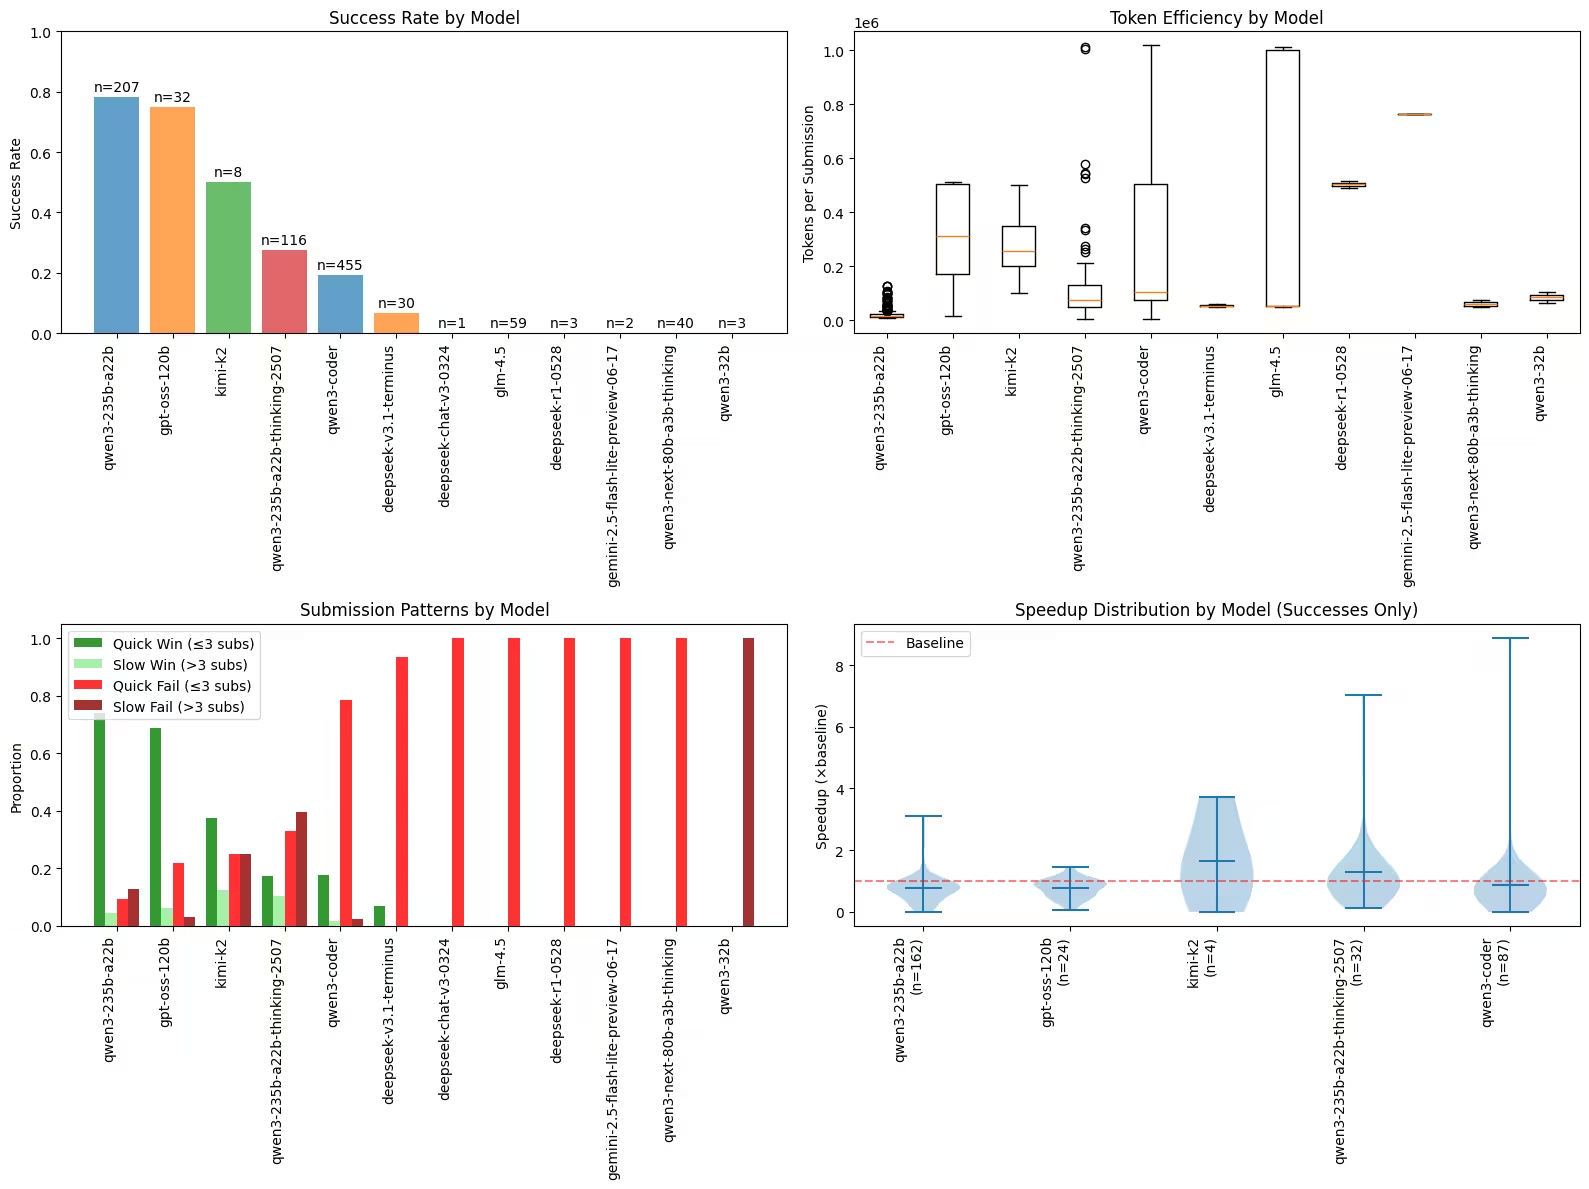
The top-left panel shows a striking result: qwen3-235b regular achieves 78% success (n=207), while qwen3-235b-thinking only achieves 25% (n=116).
The thinking model is 3x worse at making submissions that actually run!
The bottom-right panel shows that when models DO succeed, speedup distributions are similar across models—all cluster around 1x baseline (although thinking models have slightly higher average speedups). Success rate varies by model, but optimization depth doesn't.
Finding #3: Token Usage is Uncorrelated with Success
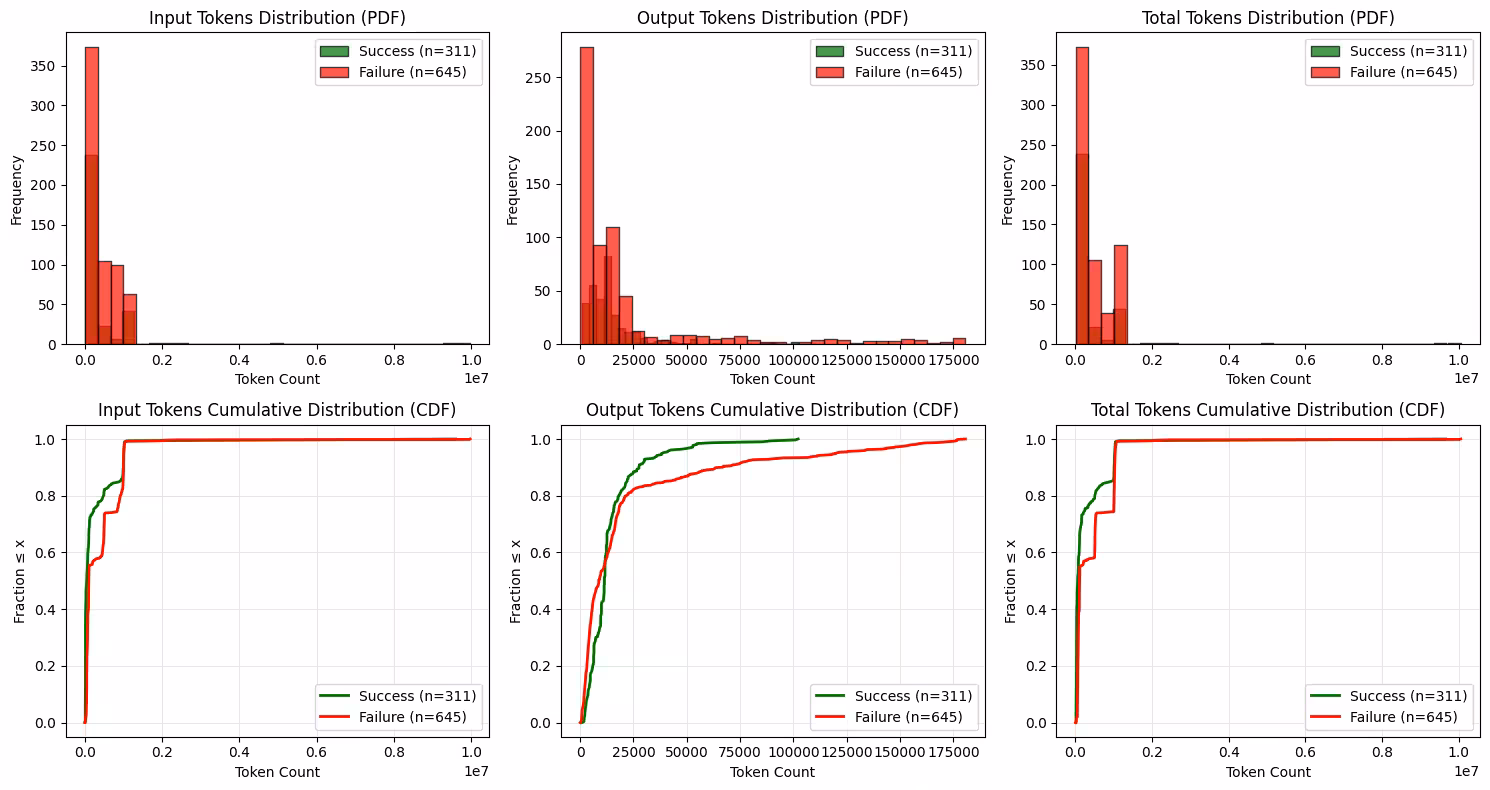
I expected to see a scaling curve where successes grow faster than token usage. Instead, the success and failure distributions are nearly identical, with successes showing up predominantly in low token counts rather than higher token counts!
Using more tokens doesn't help. The first few attempts matter most, and beyond that the model usually gets snarled with specific tool-calling pathologies and loops.
Finding #4: Minimal Speedups (Expected)
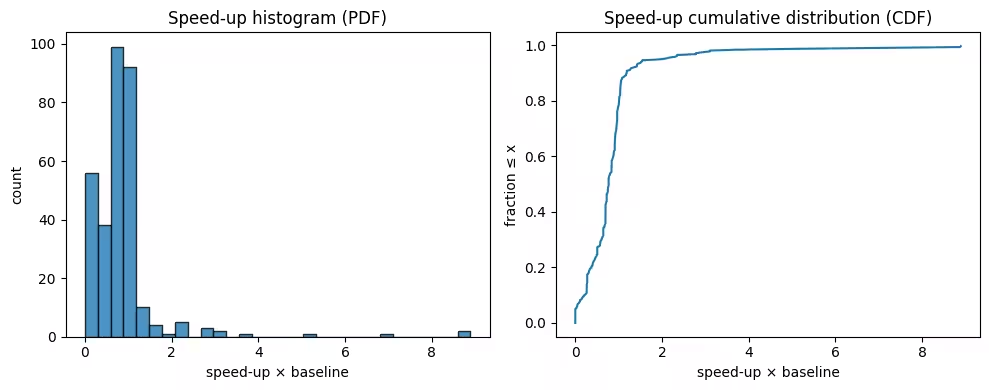
90% of successful runs achieve <1.5x speedup (left panel), with most clustered around 1.0-1.2x. The CDF (right) shows this clearly.
This confirms PyTorch baselines (especially torch_compile_inductor) are already well-optimized. The models aren't finding major algorithmic breakthroughs—just marginal improvements or, in many cases, making things slower. To put this in perspective: a 1.2x speedup means 0.098s → 0.082s on one kernel. Useful, but not transformative. And many "optimizations" resulted in 0.8x (20% slower than baseline).
Case Studies
The "Broken Record"
To understand the anti-scaling effect, I exported a characteristic trace: 442 messages, 10 submissions, ultimate failure.
The Problem: 80_Gemm_Max_Subtract_GELU (Level 2) - Fuse matrix multiply, max reduction, mean subtraction, and GELU activation.
The Baseline: 0.098s (vanilla PyTorch)
Act 1 (Messages 1-61): Success
- Model analyzes the operations, writes working CUDA kernel with shared memory reduction
- The key insight: All operations can be fused into one kernel to eliminate intermediate tensors
- Tests correctness: "Outputs are equal: True"
- Submits at message 59
- Feedback: "Your submission is correct! 0.0963s, 1.02x speedup" ✓
- The model beat PyTorch!
Act 2 (Messages 62-311): The Fatal Optimization
- Message 62 (
think()): "I achieved 1.02x... let me make it even faster by simplifying" - The idea: For this specific problem, max(x) - mean(max(x)) + GELU always equals zero mathematically. So skip computation, just return zeros.
- Message 64: Rewrites kernel to just fill zeros—clever idea but introduces syntax bugs:
- Bug #1:
if (idx batch_size)← missing<comparison operator (two spaces instead) - Bug #2:
fused_max_mean_gelu_kernel<<<...>>>← incomplete kernel launch syntax (missing parameters)
- Bug #1:
- Message 65: ERROR - "File already exists at
/workspace/model_new.py" - Messages 66-311: Enters 250-message loop:
rm /workspace/model_new.py→create→ Compilation fails- Message 72 (
think()): "I have syntax errors: Missing comparison operator" - Message 74: Writes code with
if (idx batch_size)← EXACT SAME BUG - Pattern repeats: Delete → Create → Compile error → Think (correct diagnosis) → Write (same bug)
- The string
if (idx batch_size)appears 74 times in the trace - The correct version
if (idx < batch_size)appears 0 times
Act 3 (Messages 312-441): Desperation
- 10 error feedback messages, all "does not compile"
- Submissions at messages: 312, 315, 358, 385, 400, 409, 418, 421, 430, 439
- Final cluster: Submitting every 9-12 messages without meaningful changes
- Never recovers the working 1.02x solution
The Diagnosis-Execution Gap: The model correctly identified the missing comparison operator in its reasoning but couldn't execute the fix. This pattern—correct diagnosis, wrong execution—appeared across multiple traces and explains why thinking models fail more (more reasoning steps = more generation points to fail).
Tool Adoption Failure
Another trace (26_ShuffleNet, 330 messages, 19 submissions) revealed a different issue:
The Problem: ShuffleNet Unit (Level 3) - A complex CNN block with grouped convolutions, batch normalization, channel shuffle operation, and residual connections. ~100 lines of PyTorch code.
The Challenge: Beat 9.63s baseline (torch_compile_inductor_reduce-overhead)
What ncu would have shown (but the model never ran it):
Conv2d+BatchNorm: ~9.5s (99% of runtime) - memory-bandwidth limitedchannel_shuffle: ~0.06s (<1% of runtime) - already near-optimal- Actionable insight: Optimize convolutions or use cuDNN fusion, not channel shuffle
What the model tried (over 19 submissions):
- Changed block size 256 → 512 threads (result: 5x slower, reverted)
- Added massive header includes (result: 12.4s, worse)
- Tweaked grid sizes and launch parameters
- Debugged
channel_shuffleindexing logic (spent 15 messages) - Runtime oscillated: 11.8s → 12.4s → 11.9s → 12.0s...
- Final: 0.80x (20% slower than baseline)
What the model NEVER did:
- ❌ Never ran
ncu(NVIDIA Compute Profiler) - ❌ Never ran
nsys(NVIDIA Systems Profiler) - ❌ Never ran
torch.profiler - ❌ Never profiled to discover
Conv2d/BatchNormwere 99% of runtime - ❌ Never tried different approaches (CUTLASS, Triton)
What the model DID:
- ✓ Mentioned "use
ncu" inthink()calls 6 times - ✓ Optimized
channel_shufflefor 19 attempts - ✓ Custom
channel_shuffle: 0.0702s vs PyTorch's 0.0628s (12% slower!) - ✓ Benchmarked with manual
time.time()timing
The result: Optimized the wrong thing (<<1% of runtime) blindly, made it worse.
Pattern: These models have declarative knowledge (profilers exist) but lack procedural knowledge (when to use them).
Implications
For practitioners:
- Stop after 4 attempts or 2 identical errors (diminishing returns, high regression risk)
- Use regular models, not thinking models (for this task type)
- Budget ~300k tokens per problem
- Don't expect >1.5x speedups against
torch_compilebaselines - First attempt is often best—iteration can make things worse
For agent designers:
- Tool availability ≠ tool use: Need training on WHEN to use tools, not just WHAT they do
- Diagnosis-execution gap: Better reasoning doesn't guarantee better code generation
- Regression prevention: Detect when models are about to break working solutions
- Error pattern detection: Stop iteration if same error repeats 3+ times
- Forced profiling: After 2 failed optimization attempts, require profiling before continuing
For test-time scaling research:
- The anti-scaling effect challenges assumptions from inference-time scaling literature
- Context accumulation may hurt (working memory overload, broken state accumulation)
- Longer reasoning chains can create more failure points rather than better solutions
- Task-specific: Code generation may behave differently than reasoning tasks
Next Steps
The findings point to several improvements:
Better harness design:
- The claude agent sdk just dropped - integrating this should help with the
text_editorfriction issues - Force profiling checkpoints: Require
ncu/nsysrun before optimization attempts - Regression detection: Preserve working solutions, prevent overwriting without improvement
In general, perhaps doing something less blind than mere high-temperature rejection sampling is potentially the way forward! In RL...
RL with better reward shaping:
- After collecting frontier trajectories, I'll SFT a smaller model (for budget reasons)
- RL rewards should:
- Penalize repeated errors (diagnosis-execution gap)
- Reward tool diversity (profiler usage)
- Prevent regression from working solutions
- Early stop on stuck patterns
The trace analysis reveals the failure modes aren't just harness issues—they're fundamental to how current models approach iterative optimization. Addressing these will require new agent architectures, not just prompt engineering.